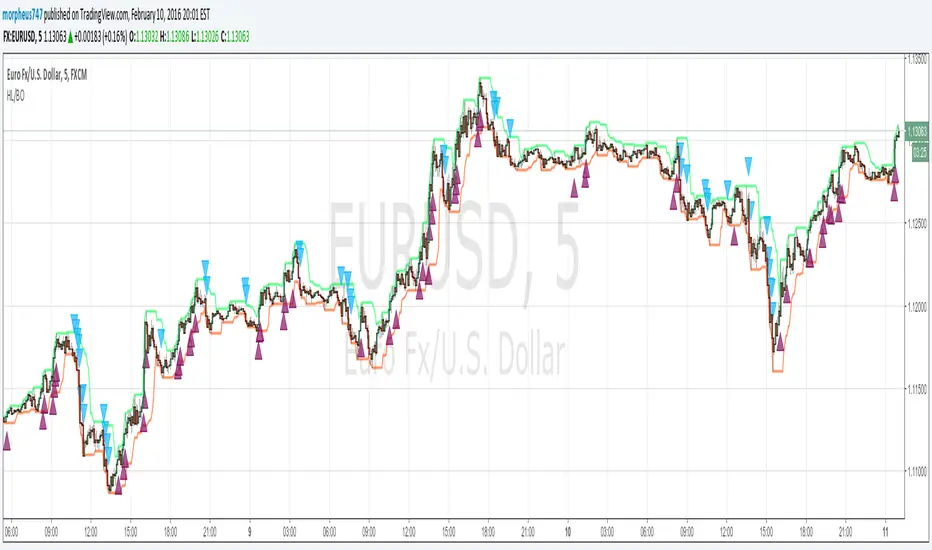
HL BREAKOUTThe base of the indicator is the breakout of historic High and lows.
There are 3 basic configurations
1° The High length that measure the latest 10 bars and make the "higher high"
2° The Low length taht measure the latest 10 bars and make the "lower low"
3° The Breakout PIPs administrator that defines how much pips are needed from the latest higher high to be defined as a level breakout.
So the strategy is super easy. The indicators show you the 10...20.. or whatever you need old bars high and lows.
When a breakout of that levels occurs and the candle "close" above or below and the close are more than "X" amount of PIPs a marker show up. The marker are the signals of buy and sell
I test some configurations, and work in all timeframes but.
I suggest
10, 10, 0.0003 for timeframes from 1m to 15m
and 10, 10, 0.0005 for timeframes higher than 15m
Maybe you need to test other configurations for 4h 1 day, etc the basics are the same in all timeframes, the main difference is the amount of pips that will be considered as "breakout" the higher timeframe the higher amount you need to prevent false positives.
Last words: 0.000X are for the PIPs for currencies that have 4 or 5 decimals like euro and other, if you use in YEN change it to a configuration of 2 digits decimal. Just that.
Have "fun" !
Search in scripts for "the strat"
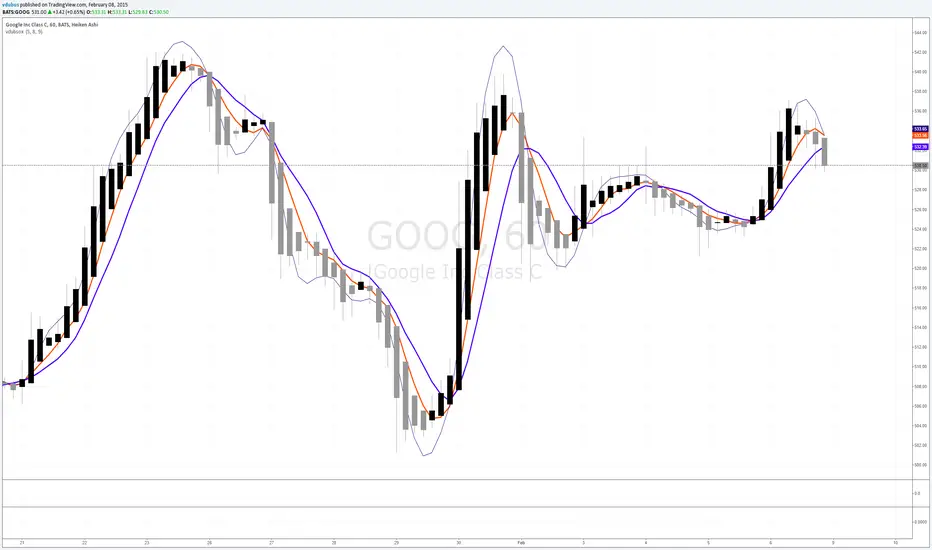
vdubsoxI've been asking for this concept for a while, a simple MA that rides the top side of the trend instead of the bottom, and by accident came across the 'Hull ma' on a TV blog post. I've added another two simple Moving averages to act as strength indicator with close proximity to the price.
The strategy is simple MA cross over but with the early indication using Hull ma gives you a heads up on trend / price reversal.
I'm using this in conjunction with BB set at 34. on a 1/3/5 min charts & Heiken Ashi to smooth out the noise with awesome success trading Binary options.